As a hotelier you are tasked with many responsibilities, including overseeing day-to-day operations, managing staff members, and ensuring that your guests have a positive experience at your hotel. Digital marketing may not always be at the top of your mind, but you are a smart, business savvy professional and you have decided to work with a team of experts who have the knowledge to help your hotel achieve its goals. Once you have done your homework and decided to implement a digital marketing strategy to help your hotel reach full potential with online booked revenue, you need to determine how you will measure success. With an abundant amount of data and reporting available to you, it can be challenging to determine which metrics are the most important to focus on.
We want to help you shine and feel confident in showcasing your digital marketing success in your internal reporting meetings. In order to do so, I spoke with our Blue Magnet leadership team to gain their insights about what they believe hoteliers should keep top of mind when they are sharing digital marketing metrics with key decision makers. Collectively, we determined five metrics that illustrate success through search engine optimization (SEO), social media, website design, paid search, and holistic digital marketing.
SEO – Understanding the Relationship between Traffic and Conversion
SEO strategy is a critical component to a hotel’s digital marketing strategy because true SEO work never ends. Search engines are constantly evolving and there will always be new opportunities to improve your hotel website’s performance in search engine results pages ( SERPs). The two key focuses for measurement of SEO strategy are traffic and conversion. Your first goal is to generate relevant traffic to your hotel website; this is accomplished by ensuring your website is optimized for keywords that will put your site in the best position to rank well in SERPs for relevant search phrases. The second goal is to convert those highly qualified visitors to your website into hotel reservations which lead to booked revenue for your hotel.
There are many metrics that help determine if your website is improving such as, sessions to site and goal conversions, but these metrics do not help you figure out what we can be done to influence an increase in relevant traffic or drive more reservations. So, you need to harness the power of analytics data and correlate the information for these two metrics. Reviewing the data together will allow you to determine how to move forward in implementing your SEO tactics to drive traffic and increase conversions.
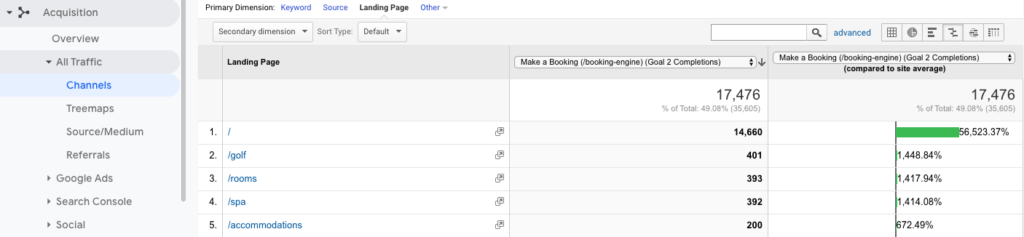
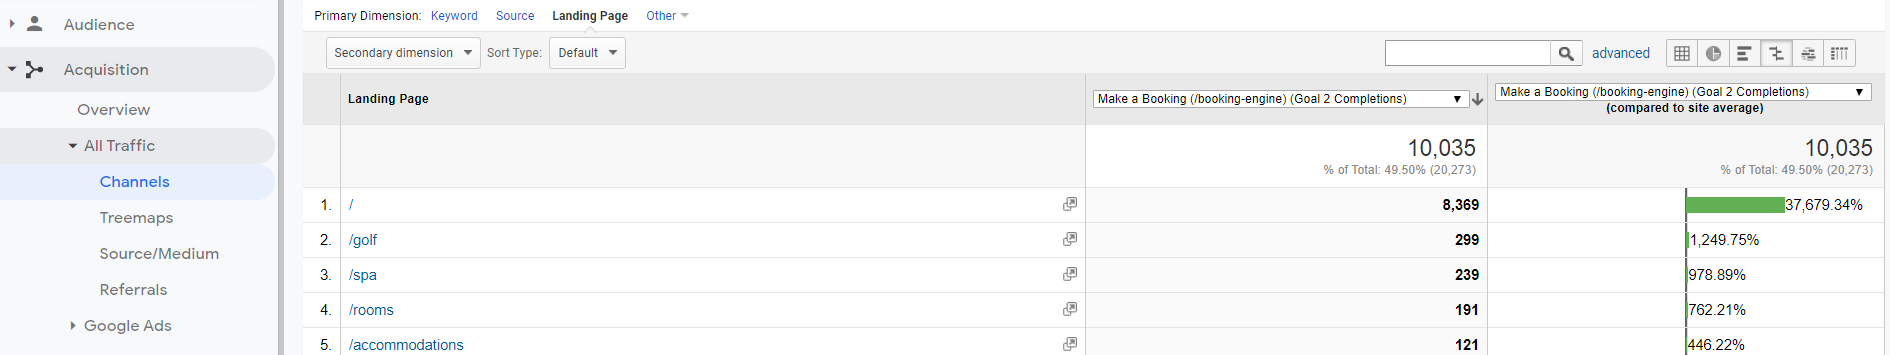
For example, knowing which page should be driving traffic to will help you figure out which page, or pages, should be audited and improved to rank higher in the SERPs. To determine this in Google Analytics, navigate to the Channels report: Acquisition > All Traffic > Channels. Next, select “Organic Traffic” and change the Primary Dimension to “Landing Page.” On the right side, there are a set of buttons, the fourth one is “Comparison.” With the “Comparison” view selected, you can compare the Check Rate Goal with the Site Average of Check Rate goal. Set the time period of six months, and you get a view of the data that lets you know which page is truly your best converting page.
Social Media – A Powerful Assistant in the Multi-Channel Conversion
It is no secret that social media is not a primary channel for driving conversions for hotel bookings. However, it is a worthy component of your digital marketing strategy because it serves as a platform where you can connect with guests, provide a sneak peek into the experience at your hotel, and differentiate your hotel from your comp set.
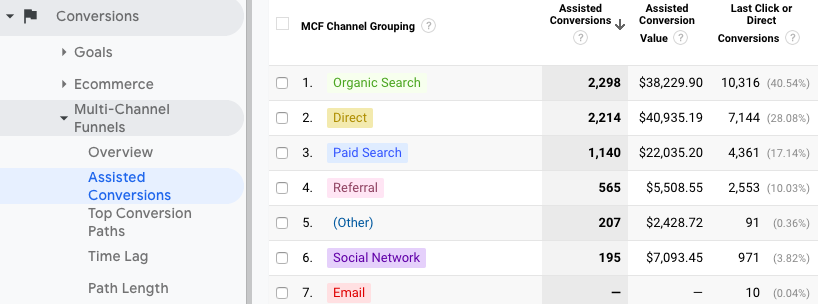
You may be wondering if there is a way to quantify your social media efforts. And the answer is yes. You can find reporting in Google Analytics’ Multi-Channel Funnel reports, which help highlight the value of social media. While social media channels may not directly influence conversion, they play a role in the booking process and therefore hold a key role in your overarching digital marketing strategy. Additionally, the Assisted Conversions report will show you how a specific channel assisted in revenue that you would not normally see in your tracking because it is often set up to give credit with last-click attribution. When examining social media in Assisted Conversions, you will see how it played a role in your website visitors journey to booking their stay at your hotel.
Having a strong social media presence can assist your SEO strategy as well. Social media marketing is one of the most valuable allies of SEO, and our team recently wrote about how social media can help your website rank higher in SERPs.
Website Design – Diving into User Experience
Within Google Analytics, you can determine how visitors are engaging with the content on your site in the Behavior reports. One of the fundamental questions of website analytic analysis is: what are users doing while they are on your website? Analyzing on-page interactions will help you formulate an understanding of how visitors are engaging with the content of your website.
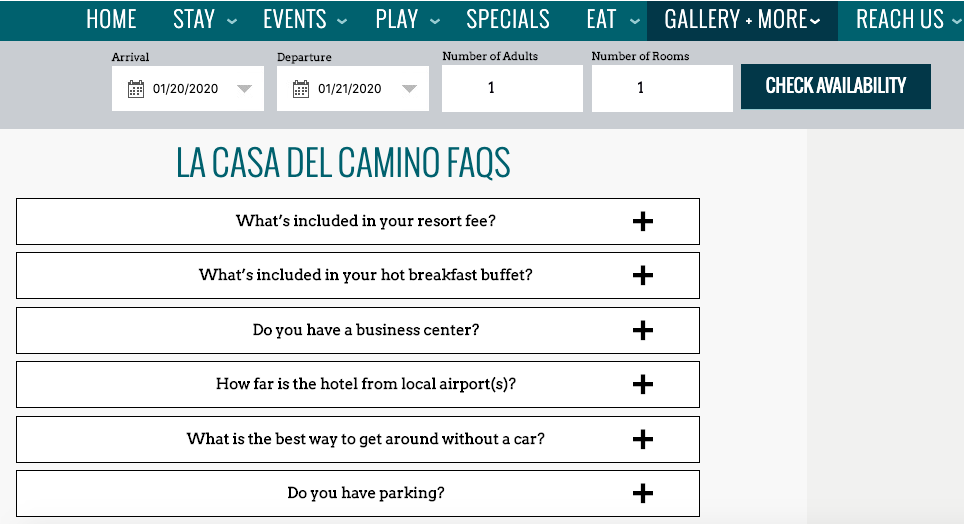
For example, your website may have an FAQ page. If you analyze the event tracking you can see which FAQ item is opened the most frequently. Therefore, you can infer which questions visitors are most eager to learn about your hotel. You can then improve the website experience by ordering those questions in popularity, adding additional copy to further answer those questions, and link to supporting content on other landing pages.
Take note of the pages on your site that are most important in communicating critical information to your guests and are your highest converting pages. These are the pages that you will want to evaluate for on-page interactions to determine if there are ways that you can improve the experience to be optimized for conversion goals.
Paid Search – Key Insights from Search Impression Share
Incorporating paid media into your digital marketing strategy allows you to take your marketing mix to the next level. By paying to play, you broaden your website’s visibility in SERPs, increase brand awareness, and set your hotel apart from competitors. One metric you should pay attention to in analyzing your Google Ad campaigns is impression share (IS). Google defines impression share (IS) as the percentage of impressions that your ads receive compared to the total number of impressions that your ads could get. Search Impression Share (SIS) is an amazing metric which shows the percentage of times your ad was shown when it was eligible for an ad auction.
A 90% impression share means your ad was selected in 90% of the ad auctions you entered. This metric also shows the last 10%, and explains why your ad lost (it could be that your ad did not rank well enough or you did not bid high enough compared to competitors). Examining your search impression share allows you to build context around how visible your ad campaign is on SERPs. Additionally, the search impression share metric will show your competitors’ impression share in relation to your own. Meaning you can gain detailed insights on how OTAs and competing hotels are bidding on for your brand name and refine your brand name campaigns based on the data.
Comprehensive Digital Marketing – Your Channels Work Together
With all of the interesting data available to you in Google Analytics, it can be easy to fall into a rabbit hole of overanalyzing every piece of data and actively seeking a way to influence each number. For example, you may get caught up on specific sources that send traffic to your website. Take a step back. Look at the big picture. Remember the digital marketing strategy that you have put in place and are currently executing. Focus on the metrics that you can control and allocate your resources to supporting those you can influence with your digital marketing tactics.
Viewing source data can be easily viewed in Google Analytics in the Acquisition reporting section. You can find this report in Acquisition > All Traffic > Channels. Understanding the contribution of each source that sends traffic to your site will help you figure out how your current tactics have supported your website performance and determine if there is opportunity to bolster your efforts toward other channels.
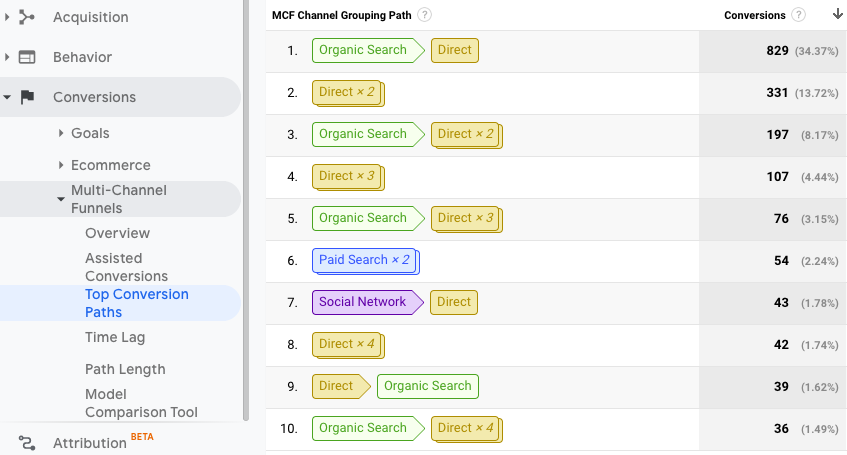
Similar to Assisted Conversions, Top Conversion Paths is an excellent report which shows how visitors engage with various channels during their search journey and which channels are involved with their conversion. Reviewing Channels and Top Conversion Paths reports will help you concentrate on the comprehensive elements of your digital marketing strategy and help you better understand the correlation of the sources of traffic and how they convert.
Take Action with Your Data
Evaluating your digital marketing strategy should not be an overwhelming task. As long as you have a clear understanding of your goals and can confidently locate the supporting data or reports, you will be able to highlight the success of your marketing activities. Once you are actively monitoring your progress through reports month-to-month and year-over-year, you will be able to identify trends and determine how you can tweak your strategy to continue improving your website’s performance.
Need more help making sense of your digital marketing data? Contact our team today to learn more about our digital marketing services.